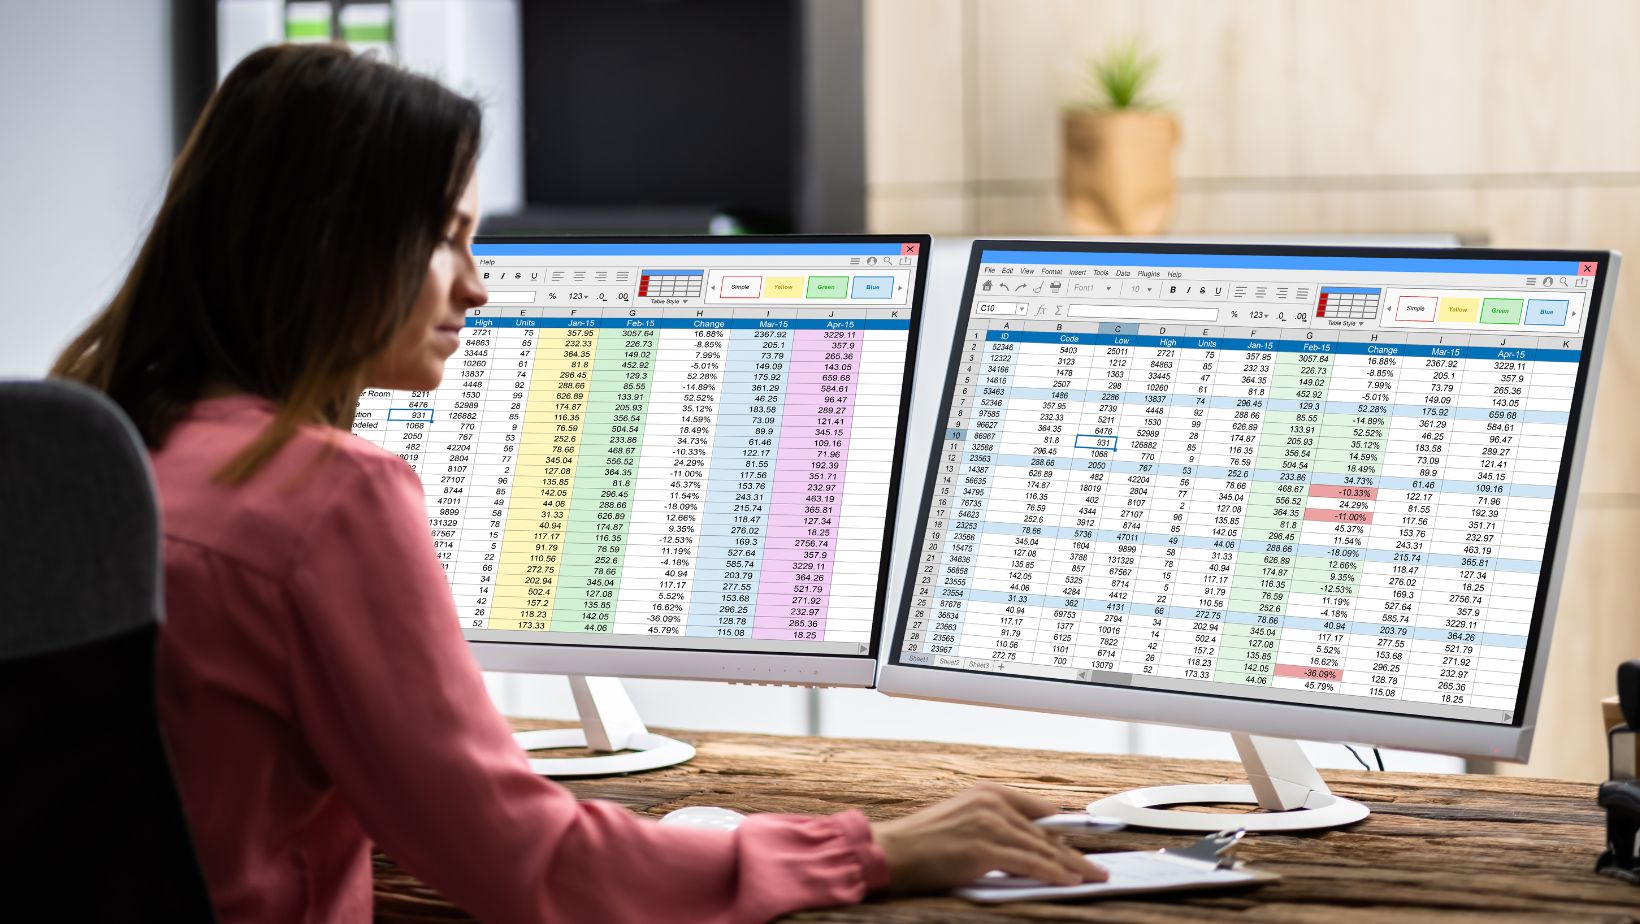
Your analysis is only as accurate as your data is clean. Whether you’re optimizing college admissions insights, business metrics, or research outcomes, most errors happen before the formulas ever run. Think of data cleaning like standardized test prep — every misplaced comma or space can cost points. Precision, repetition, and structure always win over shortcuts.
The smartest analysts aren’t faster — they’re more systematic. They use Excel like a strategist, not a spreadsheet tourist.
1. Audit Your Structure Before You Touch Anything
Every clean dataset starts with a question: What does one row represent? If one row is a student, a sale, or a transaction, make sure every column describes that same entity.
No merged headers. No subtotals inside data. Just clean columns and meaningful names.
This is your “bubble sheet” moment — one cell, one meaning.
2. Check Data Types — Numbers, Dates, Text
Excel’s biggest hidden trap? Misread data types.
If numbers align left, Excel thinks they’re text. Use:
=ISTEXT(A2)
=ISNUMBER(A2)
Correct before calculating anything. Analytical accuracy starts here.
3. Clean Text Like a Copy Editor
Spaces, capitalization, and invisible characters are the silent killers of accurate lookups. Use:
- TRIM() – removes extra spaces.
- CLEAN() – deletes hidden formatting.
- PROPER() – standardizes names.

Always store the cleaned version in a new column — never overwrite raw data. Think of it like essay drafting: your “original” is sacred.
4. Use Find & Replace with Intent
Quick fixes often create quiet chaos. If you replace “CA” with “California,” be sure it’s not buried in “CAMPUS.”
Best practice: filter unique values first, confirm meanings, then replace. Precision matters more than speed.
5. Split Composite Data (Dates, Names, Codes)
You can’t analyze what Excel can’t separate. Composite values — “Doe, John” or “2025-11-03 09:30:00” — block proper sorting.
To handle timestamps, here’s how to separate date and time in Excel:
=INT(A2) → date only
=A2-INT(A2) → time only
Then format each column appropriately. Clean splits lead to cleaner logic downstream.
6. Visualize Errors with Conditional Formatting
Instead of hunting manually, color-code mistakes:
- Highlight duplicates.
- Flag blanks or errors using formulas:
=OR(A2=””,ISERROR(A2))
It’s like seeing your diagnostic test results before the big exam — you instantly know where to focus.
7. Standardize Categories with Lookup Tables
“California,” “Calif,” and “CA” should never be three separate entries. Build a lookup table:
=VLOOKUP(A2,StandardList!A:B,2,FALSE)
Every pivot table thanks you later. Data consistency is coherence — the same principle that drives strong admissions essays.
8. Handle Missing Data Transparently
Empty cells can mean “not applicable,” “not reported,” or “zero.” Don’t guess.
Create an error flag column:
=IF(A2=””, “Missing”, “OK”)
Count, decide, and document how you handled it. Integrity beats convenience every time.
9. Automate Cleaning with Power Query
Power Query is Excel’s most underrated feature. It records every cleaning step — from trimming text to removing columns — like a macro you can replay.
When new data arrives, just hit Refresh.
You’ve turned messy imports into a repeatable pipeline — the equivalent of building an automated test-prep system for your spreadsheets.
10. Document, Validate, and Version
Your cleaned file is an asset. Label it clearly:
Admissions_Clean_2025-11-03_v1.xlsx
Then document every change in a simple “Data Dictionary” sheet — variable names, descriptions, data types, transformations.
This creates transparency, reproducibility, and trust — the data-world version of a well-cited essay.
Real-World Example
Imagine analyzing student application data. You import three files: test scores, demographics, and submission timestamps. The timestamps mix date and time, states are listed inconsistently, and GPAs are formatted as text.
By applying these steps — splitting columns, trimming text, validating formats, standardizing state codes, and refreshing via Power Query — you create one reliable dataset ready for regression analysis or dashboard visualization.
That’s what strategic prep looks like: systematic, repeatable, verifiable.
Final Framework: The 3P Rule — Prepare, Process, Prove
- Prepare: Audit structure and types before touching data.
- Process: Clean with formulas and automation.
Prove: Validate and document every transformation.
Closing Insight
Clean data isn’t glamorous, but it’s the foundation of every trustworthy insight.
Brooke Hanson might say: “Preparation isn’t about privilege — it’s about precision.”
The same goes for data. When your Excel sheets are organized, your thinking is, too. You’re not just building a dataset; you’re building a system of clarity.
Because in both testing and analytics, confidence doesn’t come from luck — it comes from structure.


