
In financial markets, price movements happen all the time, and traders desire this because there is no way profits can be made if there are no price movements. But these movements are not consistent. There are times when the price can move so quickly and powerfully in one direction before it starts to weaken and move in a different direction.
No trend is expected to last forever, and catching a trend reversal early, allows you to exit a position before the movement starts and discover the best time to enter the new trend and make more from it. With that in mind, here are some steps that you should keep in mind when identifying a trend reversal and trading with its accompanying uncertainties.
Using the three drives pattern
Harmonic patterns are chart patterns used as part of trading strategies because of their ability to predict future price movements; the three drives pattern falls under this category.
Specifically, the three drives pattern is a harmonic reversal pattern and can either be a bullish pattern or a bearish one. Just like other harmonic patterns, identifying this pattern is complex because there are specific requirements that need to be in place for the design to be accurate.
After identifying whether the prevailing trend is a bullish or bearish one, name three successive directional movements as Drive 1, Drive 2, and Drive 3, and they should meet the following parameters:
- Point A is at the 61.8% retracement of 1
- Point B is a 61.8% retracement of 2
- Two is at the 127.2%-161.8% extension of A
- Three is at the 127.2-161.8% extension of B
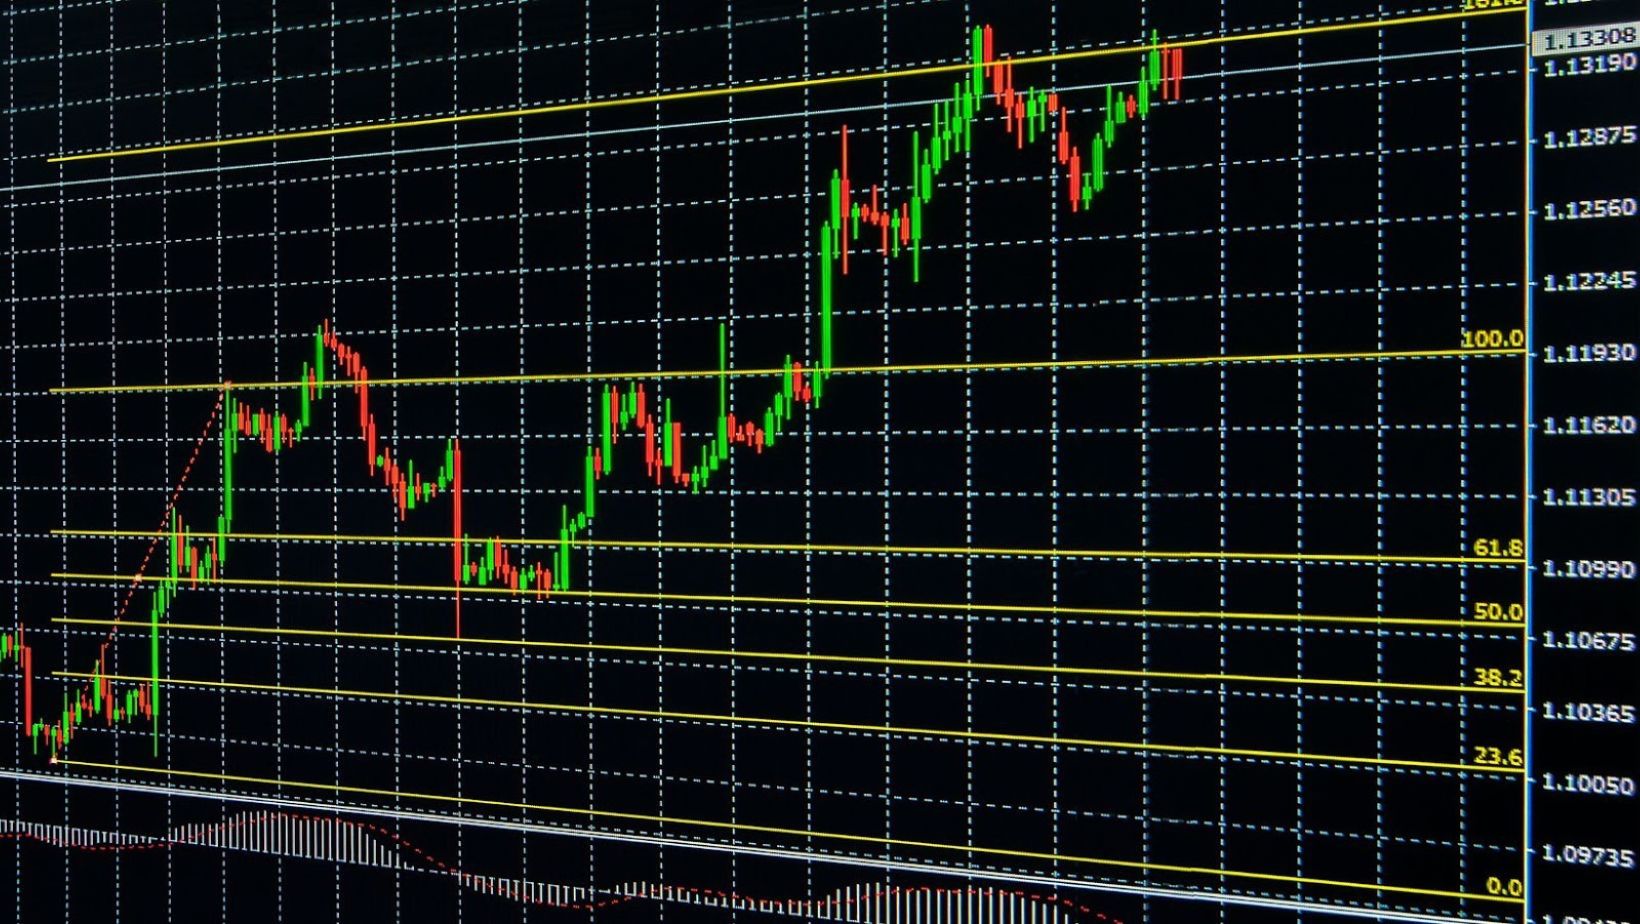
You can use indicators like Fibonacci retracements to verify the pattern. It is crucial to identify previous swing points first because this is where the Fibonacci retracements will be applied.
The best way to use the Three Drives pattern to catch a trend reversal is to enter the market when drive three is fully formed. In an existing bearish trend, you can buy, but when the current trend is bullish, you can sell your position.
If the trend is a bullish three drives pattern, it is advisable to place the stop-loss order under the extreme formed by the third drive, and if it is a bearish pattern, it should be placed above the extreme established by the third drive. Setting profit targets using the three drives pattern depends on your trading strategy and the time frame you are working with.
Look for breakouts from consolidation.
Consolidation in financial markets usually appears due to the market’s indecisiveness, and it describes the range activity of an asset for some time.
That is the price movement of an asset within support and resistance levels. But this consolidation period can be broken, indicating that a new trend is about to start, and examining breakouts can be an excellent way to identify trend reversals.
For trading breakouts, examine the current price trend to set out potential entry and exit points. If the movement goes upward and through the resistance level, traders can decide to buy in anticipation of the continuation of the uptrend.
However, this trading decision must be backed up by both technical and fundamental analysis because, in a highly volatile or shaky market, this can result in a false breakout and become a downtrend.
Also, traders looking to buy the breakout should have risk management tools, such as stop-loss orders to reduce losses if the price falls back after an upward flight. Where the price breaks through the support level, you can enter a short position.
Regardless of what strategy you are using when the breakout occurs, it is necessary to wait for confirmation of the new trend to see whether the price will maintain its current levels, increase, or retrace back. If the trade should fail, cut back your losses by exiting the business quickly.
Use short-term strategies
In a shaky market where the prices are constantly moving back and forth, the goal is to take profits wherever you can, and the best way to do that is to trade with short-term strategies. Using a short-term approach also allows you to identify and quickly take advantage of the trend reversal when the momentum is still there.
For a short-term strategy, it is essential to set specific price targets and sell positions when enough profit has been taken. Since you need to minimize losses, the system should contain adjustments that will allow you to exit trades quickly.
Use the RSI indicator.
Relative Strength Index or RSI is a reversal indicator used to measure the strength of price changes. It is also suitable for finding overbought and oversold levels when trading. With this, you can predict when a trend reversal will happen in a shaky market.
The RSI oscillates between 0 and 100, and where the RSI value of an asset goes about 70, it is considered to be overbought, but if it falls below 30, it is an oversold asset. When it signals that the support is overbought, you can sell. RSI is usually combined with MACD and Moving Average crossovers to confirm price reversal signals and help you identify price reversals quickly.
Plus, RSI divergences can indicate possible trend reversals. For instance, where the price of an asset has higher highs and the RSI attains lower highs, this results in a bearish divergence and can be taken as a signal that there will be a potential downtrend. But when the asset has lower lows and the RSI forms higher lows, a bullish divergence occurs, and there will be a possible reversal into an uptrend.
Although it is a valuable indicator for spotting trend reversals, the RSI has its limitations when it comes to a long-term trend. It is more effective when combined with other hands like the one discussed above.
Difference between Retracement and Trend Reversal
There is always a bit of uncertainty about whether a change in the direction of an asset is a long-term change or market noise. Trading without knowing the current condition of purchase in a volatile market can be frustrating and affect how successful your trades will be. This is why before anything, traders should be able to identify trend reversals and retracements correctly.
Definitions
A retracement is a temporary reversal in a more significant trend. The main difference between a retracement and a trend reversal is that it doesn’t last long and doesn’t show that a long-term trend will change. On the other hand, a trend reversal happens when the price moves in a direction that is different from the existing trend. This reversal occurs for a prolonged period, and the asset’s cost tends to experience a significant change as it can either increase or decrease. Also, the price change can happen as soon as the reversal happens, or it could take some days or weeks to appear.
Appearance
Retracements appear after significant gains are made, and it is possible to notice buyers’ interest and activity during the decline. Reversals can happen anytime, and if the potential trend is a downtrend, there will be little buying interest concerning the asset in question.

Indicators
Indicators like Fibonacci retracements and pivot points can be used to identify retracements, while tools like Bollinger Bands, Moving Averages, and RSI indicators can spot reversals. Trend lines can be used by traders to specify both.
When a retracement happens, there are three options available to the trader:
Don’t sell and hold your position. The catch to this is that there could be losses if the retracement turns out to be a reversal.
Close your position and re-buy if the price starts to move with the more significant trend. The downside to taking this action is that it could result in missed trading opportunities if the price recovers quickly.
Sell your position permanently, but this will also result in missed opportunities if the price recovers.
Learning the difference between these two phenomena is one of the first steps toward becoming a better trader because you can capitalize on critical opportunities while reducing losses.
Final Thoughts
Although no method can show you a trend reversal ahead of time and with 100% accuracy, using the techniques discussed and further technical analysis can help you catch on to trend reversals early on, especially in shaky or volatile financial markets.


